

- 联系我们
- duidaima.com 版权声明
- 闽ICP备2020021581号
-
 闽公网安备 35020302035485号
闽公网安备 35020302035485号

// +build ignore
package main

import "fmt"

func main() {
    num := 3601
    fmt.Println(toTime(num))
}

func toTime(num int) string {
    return fmt.Sprintf("%d = %dh:%dm:%ds", num, (num / 3600), (num / 3600 / 60), (num % 60))
}
其中 build 标签需要放到源代码文件的包声明语句头部,build 标签也可以使用逻辑运算符 &&、|| 和 ! 来组合多个条件,例如这表示只有在 Linux 的 amd64 架构上才能编译,但不是不能在 Darwin 的 386 和 arm64 架构上编译。// +build linux,amd64 && !darwin && !386 && !arm64
package main
import "syscall"
func main() {
syscall.Syscall(1, 0, 0, 0) // This is the "exit" syscall on Linux
}
最后使用 GOOS=linux GOARCH=amd64 go build 就可以生成对应的平台架构二进制文件。另外一个标签在范型特性没有出现之前使用的比较多,在源代码中包含 //go:generate 指令,我们可以在构建时执行一些自定义的命令或脚本,以自动生成一些代码或文件,例如在编译之前使用 go generate 就会生成了一个名字位 version.go 文件输出当前 Go 的 SDK 版本:package main
import "fmt"
//go:generate sh -c "echo \"package main\n\nconst VERSION = \\\"$(go version | awk '{print $3}')\\\"\" > version.go"
func main() {
fmt.Println("Version:", VERSION)
}
还可以指定结构体自定义的名称,历史代码中结构体和函数都可以复用自定义名称,方便复用已经存在函数和代码,只是重新创建了一个别名:type People struct {
Name string `json:"name"`
Age int `json:"age"`
} // +person
//go:generate some-code-generator --name=ToString --group=toStr
func ToString() string {
// dosomething
}
另外用的比较少的为 cgo 编程,使用 //go:cgo_import_dynamic 是 Go 中用于指定在 C 代码中导入动态链接库中的函数的名称、库名和符号的标签,例如:package main
import (
"unsafe"
)
//go:noescape
func Copy(dest, src []byte) int {
n := len(src)
if len(dest) < n {
n = len(dest)
}
if n > 0 {
copy(dest[:n], src[:n])
}
return n
}
func main() {
buf1 := make([]byte, 10)
buf2 := make([]byte, 20)
// 使用 Go 语言的 copy 函数复制切片
n := copy(buf1, buf2)
println(n)
// 使用 C 语言的 memcpy 函数复制内存
n = Copy(buf1, buf2)
println(n)
// 使用 unsafe 包将一个字符串转换为一个不可变的 []byte 切片
s := "hello"
b := *(*[]byte)(unsafe.Pointer(&s))
println(string(b))
}
在上面例子中,使用了 go:noescape 指令来确保 Copy 函数中的指针不会被意外地逃逸到堆上。因为 Copy 函数实际上是一个简单的内存复制函数,不需要对切片进行任何操作,所以使用 go:noescape 指令可以避免额外的内存分配和拷贝操作,提高性能和可靠性。package main
import "fmt"
//go:noinline
func myFunc(x int) int {
return x + 1
}
func main() {
// 调用 myFunc 函数 10 次,并打印返回值
for i := 0; i < 10; i++ {
fmt.Println(myFunc(i))
}
}
上面代码中我们在 fmt.Println 函数中调用了 myFunc 函数,并且循环了 10 次,智能编译器开启了函数内联优化,就会降低函数的调用的时候开销,具体是编译器实现的。如果我们不使用 //go:noinline 指令,并将 myFunc 函数内联到 main 函数中,那么编译器可能会优化掉大部分函数调用开销。但是由于我们禁用了内联优化,编译器将生成一个函数调用指令,每次调用 myFunc 函数时都会执行额外的逻辑,从而使得每个函数调用都有一些开销。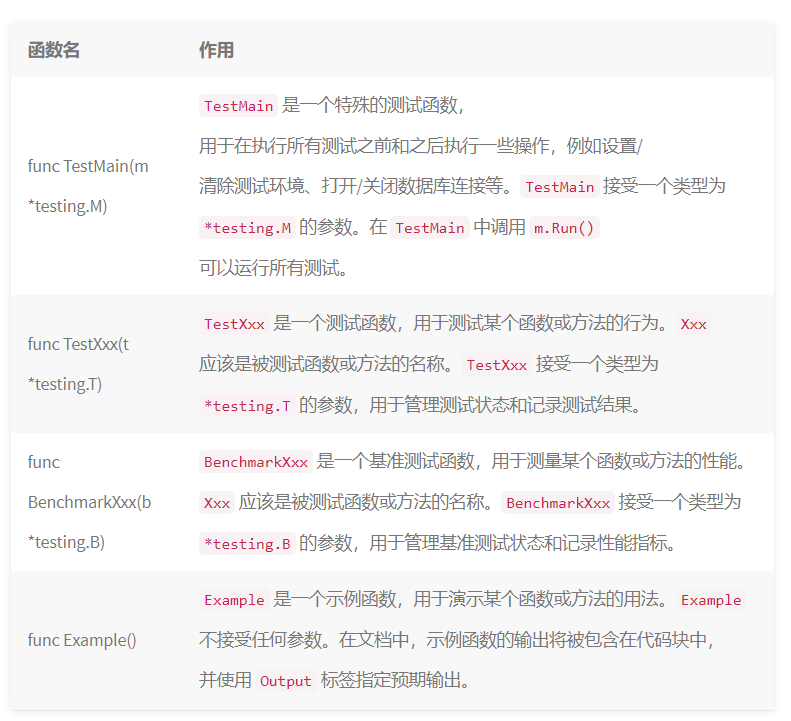
package main

import (
    "fmt"
    "os"
    "testing"
)

func TestMain(m *testing.M) {
    // 执行一些初始化操作,例如设置测试环境
    fmt.Println("TestMain setup")
    // 调用 m.Run() 运行所有测试
    exitCode := m.Run()
    // 执行一些清理操作,例如关闭数据库连接
    fmt.Println("TestMain teardown")
    // 退出测试,并使用 exitCode 作为退出状态码
    os.Exit(exitCode)
}

func TestAddition(t *testing.T) {
    // 测试加法函数的行为
    result := add(2, 3)
    if result != 5 {
        t.Errorf("Expected 5, but got %d", result)
    }
}

func add(a, b int) int {
    return a + b
}
而简单的单元测试可以使用 t *testing.T 进行测试,没有前置和后置条件,例如下面代码:# go test -run=^TestAdditio$
func TestAddition(t *testing.T) {
result := Add(2, 3)
if result != 5 {
t.Errorf("Addition failed. Expected 5 but got %d", result)
}
}
上面的代码可以通过 go test 命令进行测试,如果有对过函数需要测试不必写多个函数名称,使用 -run 参数后面的字符串是一个正则表达式,^ 和 $ 表示匹配字符串的开头和结尾,上述命令将只运行名为 TestAddition 的测试用例。package main
import (
"math/rand"
"testing"
)
// 基准测试随机数生成器的性能 go test -bench=.
func BenchmarkRand(b *testing.B) {
for i := 0; i < b.N; i++ {
rand.Int()
}
}
单个测试用例不能有效的测试函数的功能,可以使用 t.Run 来测试多个条件情况下预期结果,来帮助完成代码健壮性测试:func TestSum(t *testing.T) {
type test struct {
name string
numbers []int
expected int
}
tests := []test{
{name: "Test Sum Positive Numbers", numbers: []int{1, 2, 3, 4, 5}, expected: 15},
{name: "Test Sum Negative Numbers", numbers: []int{-1, -2, -3, -4, -5}, expected: -15},
{name: "Test Sum Mixed Numbers", numbers: []int{-1, 2, 3, -4, 5}, expected: 5},
}
for _, tc := range tests {
t.Run(tc.name, func(t *testing.T) {
result := Sum(tc.numbers...)
if result != tc.expected {
t.Errorf("Sum(%v) = %d; want %d", tc.numbers, result, tc.expected)
}
})
}
}
上述代码中提供了多个参数多个测试条件看是否正常提供单元测试,称之为 Tables Test ,内置的 testing 包功能很多,可以查看观点的 API 文档 testing,另外的网络服务的话可以使用端点测试和调用测试,这些可以使用现有的 Postman 工具进行测试。// Package mypack provides utility functions for performing various operations.
package mypack
// MaxRetryCount specifies the maximum number of times to retry a failed operation.
var MaxRetryCount = 5
// IsZero returns true if the complex number is zero.
func (c Complex) IsZero() bool {
return c.real == 0 && c.imag == 0
}
上面都是为一些常用代码注释格式,按照规范编写之后,使用内置的 go doc [package |symbol] 来查看对应的文档信息,例如 go doc fmt.Println 可以查看这个函数的作用。另外是为代码片段生产对应的文档信息,方便 pkg.go.dev 建立索引信息,要为代码编写 Example 的代码示例,从而让 go doc 来生产对应的 API 文档信息,例如编写一个简单 Add 函数:package calculator
import (
"fmt"
"os"
)
// Add returns the sum of two integers.
func Add(a, b int) int {
return a + b
}
// ExampleAdd demonstrates how to use Add.
func ExampleAdd() {
fmt.Println(Add(2, 3))
// Output: 5
}
func main() {
doc := `Package calculator provides basic math operations.`
fmt.Fprintln(os.Stdout, doc)
}
在 ExampleAdd 函数中编写了关于如何使用 Add 函数的示例,并使用 fmt.Println 打印出了 Add(2, 3) 的结果。在 // Output: 注释下面,我们写下了期望的输出值(即 5),这个注释是 Go 的一个特殊注释,它与示例函数一起使用,可以用于验证示例是否正确,就可以使用 go doc --package 命令来生成对应注释文档了。
package math

func init() {
    Math := make(map[string]func(n, m int) int, 4)
    Math["add"] = Add
    Math["sub"] = Sub
    Math["multi"] = Multi
    Math["div"] = Div
}

func Add(n, m int) int {
    return n + m
}
func Sub(n, m int) int {
    return n - m
}
func Multi(n, m int) int {
    return n * m
}
func Div(n, m int) int {
    return n / m
}
对应的测试代码:package math_test
import "testing"
func TestMath(t *testing.T) {
// 自定义测试结构体
type MathCase struct {
n, m, result int
}
// 自定义子测试map
testGroup := map[string]MathCase{
"add": {1, 2, 3},
"sub": {3, 1, 2},
"multi": {3, 2, 6},
"div": {6, 2, 3},
}
// 测试执行函数
for name, mathCase := range testGroup {
t.Run(name, func(t *testing.T) {
s := -1
switch name {
case "add":
s = Add(mathCase.n, mathCase.m)
case "sub":
s = Sub(mathCase.n, mathCase.m)
case "multi":
s = Multi(mathCase.n, mathCase.m)
case "div":
s = Div(mathCase.n, mathCase.m)
default:
t.Fatalf("No executable testing name :%s", name)
}
if mathCase.result != s {
t.Fatalf(" add computer result error, want %d , got %d", mathCase.result, s)
}
})
}
}
整个测试覆盖率支持生成 html 报表的方式进行展示,需生成对应的 cover 文件,如何通过文件生成对应 html 通过浏览器浏览,通过go test -cover -coverprofile=cover.out 的 coverprofile 参数用来将覆盖率相关的记录信息输出到一个文件,在使用 go tool cover -html=cover.out ,结果如下图: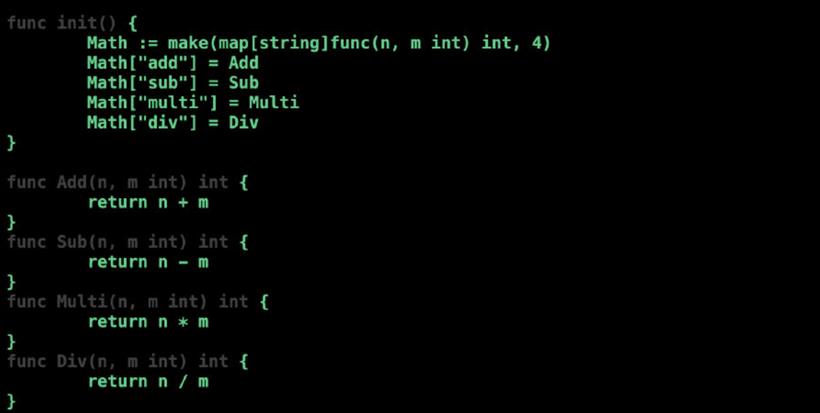
package main

import (
    "log"
    "net/http"
     _ "net/http/pprof"
)

func main() {
    // 在主程序的某处开启 pprof 监听,端口号为 6060
    log.Println("start pprof server...")
    go func() {
        err := http.ListenAndServe("localhost:6060", nil)
        if err != nil {
            log.Fatalln("pprof server start failed: ", err)
        }
    }()

    // 程序的其他逻辑代码
    ...
}
在代码中添加需要分析的代码段,代码中的 runtime/pprof 包提供了自定义 profile 的方法:package main
import (
"fmt"
"os"
"runtime/pprof"
)
func main() {
// ...
// 堆代码 duidaima.com
// 创建一个 CPU profile 文件
f, err := os.Create("cpu.prof")
if err != nil {
panic(err)
}
defer f.Close()
// 开始 CPU profiling
if err := pprof.StartCPUProfile(f); err != nil {
panic(err)
}
defer pprof.StopCPUProfile()
// 需要分析的代码
for i := 0; i < 100000; i++ {
fmt.Println(i)
}
// ...
}
运行应用程序,运行应用程序后,可以在浏览器中打开 http://localhost:6060/debug/pprof/ 来查看当前的 profiling 数据,这些数据包括 Goroutine、堆内存、堆内存分配、阻塞 goroutine 等等,例如下面有一段简短问题代码,可以使用这个工具进行分析:package main
import (
"flag"
"fmt"
"os"
"runtime/pprof"
"time"
)
// 一段有问题的代码
func logicCode() {
var c chan int
for {
select {
case v := <-c:
fmt.Printf("recv from chan, value:%v\n", v)
default:
}
}
}
func main() {
var isCPUPprof bool
var isMemPprof bool
flag.BoolVar(&isCPUPprof, "cpu", false, "turn cpu pprof on")
flag.BoolVar(&isMemPprof, "mem", false, "turn mem pprof on")
flag.Parse()
if isCPUPprof {
file, err := os.Create("./cpu.pprof")
if err != nil {
fmt.Printf("create cpu pprof failed, err:%v\n", err)
return
}
pprof.StartCPUProfile(file)
defer pprof.StopCPUProfile()
}
for i := 0; i < 8; i++ {
go logicCode()
}
time.Sleep(20 * time.Second)
if isMemPprof {
file, err := os.Create("./mem.pprof")
if err != nil {
fmt.Printf("create mem pprof failed, err:%v\n", err)
return
}
pprof.WriteHeapProfile(file)
file.Close()
}
}
可以看到上面的那个 select 代码块里面的 channel 没有初始化,会一直阻塞着这样一个简单的代码可以通过我们肉眼出来了,但是如果是复杂的我们就需要使用 go tool pprof cpu.pprof 工具来分析具体错误在哪里,分析结果如下:$: go tool pprof cpu.pprof
Type: cpu
Time: May 16, 2020 at 12:59pm (CST)
Duration: 20.14s, Total samples = 56.90s (282.48%)
Entering interactive mode (type "help" for commands, "o" for options)
(pprof) top3
Showing nodes accounting for 51.91s, 91.23% of 56.90s total
Dropped 7 nodes (cum <= 0.28s)
Showing top 3 nodes out of 4
flat flat% sum% cum cum%
23.04s 40.49% 40.49% 45.18s 79.40% runtime.selectnbrecv
17.26s 30.33% 70.83% 18.93s 33.27% runtime.chanrecv
11.61s 20.40% 91.23% 56.83s 99.88% main.logicCode
(pprof) list logicCode
Total: 56.90s
ROUTINE ======================== main.logicCode in /Users/ding/Documents/GO_CODE_DEV/src/Lets_Go/lets_37_pprof/main.go
11.61s 56.83s (flat, cum) 99.88% of Total
. . 16:// 一段有问题的代码
. . 17:func logicCode() {
. . 18: var c chan int
. . 19: for {
. . 20: select {
11.61s 56.83s 21: case v := <-c:
. . 22: fmt.Printf("recv from chan, value:%v\n", v)
. . 23: default:
. . 24:
. . 25: }
. . 26: }
(pprof)
通过 go 的 pprof 就已经分析出来了包为 main 中的 main.logicCode 函数存在一些问题,cpu 资源占用过多,如何对症下药就可以解决这些问题了。