

- 联系我们
- duidaima.com 版权声明
- 闽ICP备2020021581号
-
 闽公网安备 35020302035485号
闽公网安备 35020302035485号

The server is calculating statistics to develop a query execution plan. If a thread is in this state for a long time, the server is probably disk-bound performing other work.这段话的意思是说,statistics这个状态是用于生成执行计划,如果较长时间出现这个状态,那么服务器的IO就比较重。我们在线上对数据库服务器进行压测,发现出现了大量的statistics的等待并非是IO重引起的,并对这个等待进行了分析。
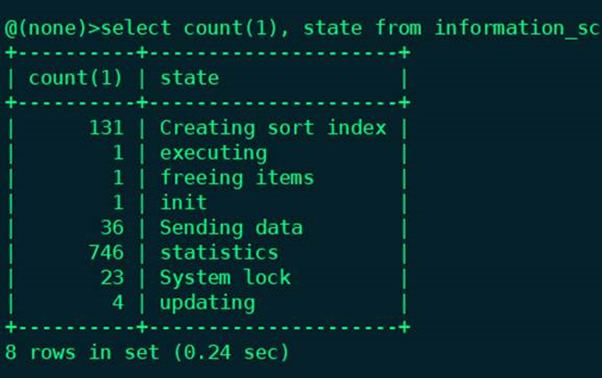
CREATE TABLE `t` (
  Col1 bigint NOT NULL,
  Col2 bigint NOT NULL,
  Col3 varchar(20) NOT NULL,
  Col4 varchar(10) NOT NULL,
  Col5 smallint NOT NULL,
  Col6 smallint NOT NULL,
  Col7 int,
  Col8 int,
  Col9 smallint NOT NULL,
  Col10 smallint NOT NULL,
  Col11 smallint NOT NULL,
  Col12 varchar(150) ,
  Col13 datetime,
  Col14 datetime,
  Col15 datetime,
  Col16 datetime,
  Col17 datetime,
  Col18 datetime, NOT NULL,
  PRIMARY KEY (col1),
  KEY ix_1 (col18),
  KEY ix_2 (col2),
  KEY ix_3 (col3, col13),
  KEY ix_4 (col3, col14),
  KEY ix_5 (col3, col13, col8),
  KEY ix_6 (col3, col13, col8, col11),
  KEY ix_7 (col3, col8,  col11, col9 ,col10, col5, col7, col13),
  KEY ix_8 (col3, col8, col9, col10, col5, col7, col13),
  KEY ix_9 (col6, col13),
  KEY idx_10 (col12)
)
我们用查询语句进行压测,当服务器QPS压到1万左右,数据库服务器的CPU使用率在85%左右,并且thread明显开始堆积。开始出现大量的statistics等待,如下图所示:
Thread 1 (process 81043):
#0 mach_read_from_2 at storage/innobase/include/mach0data.ic:96
#1 page_header_get_field at storage/innobase/include/page0page.ic:176
#2 page_dir_get_n_slots at storage/innobase/include/page0page.ic:699
#3 page_cur_search_with_match at storage/innobase/page/page0cur.cc:519
#4 btr_cur_search_to_nth_level at storage/innobase/btr/btr0cur.cc:1446
#5 btr_pcur_open_with_no_init_func at storage/innobase/include/btr0pcur.ic:530
#6 row_search_mvcc at storage/innobase/row/row0sel.cc:5203
#7 ha_innobase::index_read at storage/innobase/handler/ha_innodb.cc:8817
#8 handler::ha_index_read_map at sql/handler.cc:3050
#9 handler::read_range_first at sql/handler.cc:7421
#10 handler::multi_range_read_next at sql/handler.cc:6488
#11 QUICK_RANGE_SELECT::get_next at sql/opt_range.cc:11254
#12 find_all_keys at sql/filesort.cc:977
#13 filesort at sql/filesort.cc:430
#14 create_sort_index at sql/sql_executor.cc:3712
#15 QEP_TAB::sort_table at sql/sql_executor.cc:2625
#16 join_init_read_record at sql/sql_executor.cc:2491
#17 sub_select at sql/sql_executor.cc:1284
#18 do_select at sql/sql_executor.cc:957
#19 JOIN::exec at sql/sql_executor.cc:206
#20 handle_query at sql/sql_select.cc:191
#21 execute_sqlcom_select at sql/sql_parse.cc:5167
#22 mysql_execute_command at sql/sql_parse.cc:2829
#23 mysql_parse atsql/sql_parse.cc:5600
#24 dispatch_command at sql/sql_parse.cc:1493
#25 do_command at sql/sql_parse.cc:1032
#26 handle_connection at sql/conn_handler/connection_handler_per_thread.cc:321
#27 pfs_spawn_thread at storage/perfschema/pfs.cc:2451
#28 start_thread () from /lib64/libpthread.so.0
#29 clone () from /lib64/libc.so.6
还有一部分线程其call stack如下:
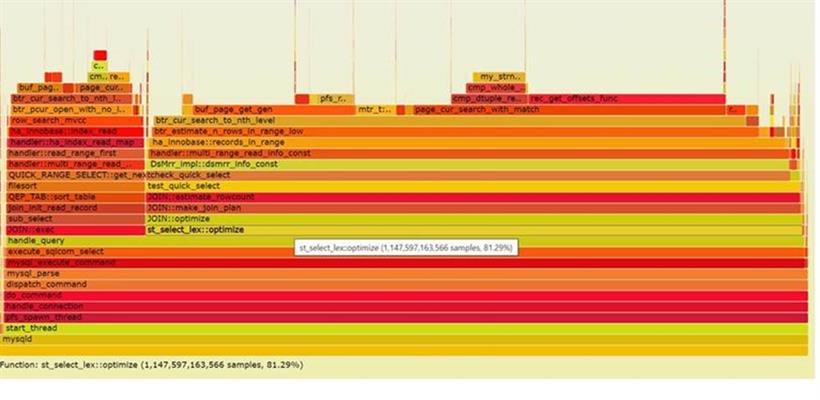
#0 rw_lock_lock_word_incr at storage/innobase/include/sync0rw.ic:317
#1 rw_lock_s_unlock_func at storage/innobase/include/sync0rw.ic:531
#2 pfs_rw_lock_s_unlock_func at storage/innobase/include/sync0rw.ic:1006
#3 buf_page_get_gen at storage/innobase/buf/buf0buf.cc:4228
#4 btr_cur_search_to_nth_level at storage/innobase/btr/btr0cur.cc:1113
#5 btr_estimate_n_rows_in_range_low at storage/innobase/btr/btr0cur.cc:5733
#6 btr_estimate_n_rows_in_range at storage/innobase/btr/btr0cur.cc:5994
#7 ha_innobase::records_in_range at storage/innobase/handler/ha_innodb.cc
#8 handler::multi_range_read_info_const at sql/handler.cc:6293
#9 DsMrr_impl::dsmrr_info_const  at sql/handler.cc:6968
#10 check_quick_select at sql/opt_range.cc:10091
#11 get_key_scans_params at sql/opt_range.cc:5859
#12 test_quick_select at sql/opt_range.cc:3113
#13 get_quick_record_count at sql/sql_optimizer.cc:6027
#14 JOIN::estimate_rowcount at sql/sql_optimizer.cc:5774
#15 JOIN::make_join_plan at sql/sql_optimizer.cc:5131
#16 JOIN::optimize at sql/sql_optimizer.cc:375
#17 st_select_lex::optimize at sql/sql_select.cc:1016
#18 handle_query at sql/sql_select.cc:171
#19 execute_sqlcom_select at sql/sql_parse.cc:5167
#20 mysql_execute_command at sql/sql_parse.cc:2829
#21 mysql_parse at sql/sql_parse.cc:5600
#22 dispatch_command at sql/sql_parse.cc:1493
#23 do_command at sql/sql_parse.cc:1032
#24 handle_connection at sql/conn_handler/connection_handler_per_thread.cc:321
#25 pfs_spawn_thread at storage/perfschema/pfs.cc:2451
#26 start_thread () from /lib64/libpthread.so.0
#27 clone () from /lib64/libc.so.6
这个线程在生成执行计划(make_join_plan), 所以也就是我们对应的statistics等待. 对于函数check_quick_select, 在相应的代码sql/opt_range.cc文件中,有如下注解:
 3. SEL_ARG GRAPH USE
  Use get_mm_tree() to construct SEL_ARG graph from WHERE condition.
  Then walk the SEL_ARG graph and get a list of dijsoint ordered key
  intervals (i.e. intervals in form

   (constA1, .., const1_K) < (keypart1,.., keypartK) < (constB1, .., constB_K)

  Those intervals can be used to access the index. The uses are in:
   - check_quick_select() - Walk the SEL_ARG graph and find an estimate of
                            how many table records are contained within all
                            intervals.
   - get_quick_select()   - Walk the SEL_ARG, materialize the key intervals,
                            and create QUICK_RANGE_SELECT object that will
                            read records within these intervals.
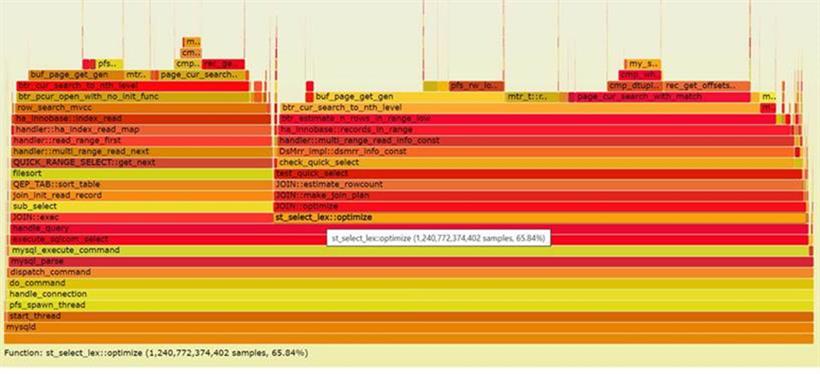
从描述中,我们可以看到,test_quick_select应该是在评估行数,SEL_ARG图在参考资料中有介绍,MySQL用于组织复杂条件并计算各个Ranges所影响到的对应可以使用的索引的代价和使用索引的不同快速方式,从而选出最优的计划。KEY ix_3 (col3, col13), # 被ix_6覆盖 KEY ix_5 (col3, col13, col8), # 被ix_6覆盖 KEY ix_8 (col3, col8, col9, col10, col5, col7, col13), #基本上被ix_7覆盖,且无使用记录删除如上三个索引后,我们进一步压测,发现QPS可以打到2万, CPU消耗在75%左右。 所以仅仅删除三个索引,就能提升性能将近一倍左右。
>show profile for query 1;
# 删除索引前 生成执行计划占比75%
+----------------------+----------+
| Status               | Duration |
+----------------------+----------+
| starting             | 0.000121 |
| checking permissions | 0.000005 |
| Opening tables       | 0.000013 |
| init                 | 0.000045 |
| System lock          | 0.000007 |
| optimizing           | 0.000021 |
| statistics           | 0.003136 |
| preparing            | 0.000029 |
| Sorting result       | 0.000006 |
| executing            | 0.000004 |
| Sending data         | 0.000008 |
| Creating sort index  | 0.000746 |
| end                  | 0.000004 |
| query end            | 0.000006 |
| closing tables       | 0.000005 |
| freeing items        | 0.000021 |
| cleaning up          | 0.000012 |
+----------------------+----------+

# 索引删除后的 生成执行计划占比28.4%
+----------------------+----------+
| Status               | Duration |
+----------------------+----------+
| starting             | 0.000457 |
| checking permissions | 0.000237 |
| Opening tables       | 0.000133 |
| init                 | 0.000145 |
| System lock          | 0.000121 |
| optimizing           | 0.000126 |
| statistics           | 0.001163 |
| preparing            | 0.000133 |
| Sorting result       | 0.000124 |
| executing            | 0.000117 |
| Sending data         | 0.000124 |
| Creating sort index  | 0.000590 |
| end                  | 0.000121 |
| query end            | 0.000125 |
| closing tables       | 0.000118 |
| freeing items        | 0.000134 |
| cleaning up          | 0.000127 |
+----------------------+----------+

# 我们用Force Index指定索引 生成执行计划占比 59%
+----------------------+----------+
| Status               | Duration |
+----------------------+----------+
| starting             | 0.000140 |
| checking permissions | 0.000008 |
| Opening tables       | 0.000016 |
| init                 | 0.000046 |
| System lock          | 0.000008 |
| optimizing           | 0.000021 |
| statistics           | 0.001606 |
| preparing            | 0.000023 |
| Sorting result       | 0.000005 |
| executing            | 0.000004 |
| Sending data         | 0.000008 |
| Creating sort index  | 0.000755 |
| end                  | 0.000005 |
| query end            | 0.000013 |
| closing tables       | 0.000006 |
| freeing items        | 0.000019 |
| cleaning up          | 0.000018 |
+----------------------+----------+