
- 联系我们
- duidaima.com 版权声明
- 闽ICP备2020021581号
-
 闽公网安备 35020302035485号
闽公网安备 35020302035485号

使得用 Python 编写网站成为可能的基础技术是 WebAssembly。最初开发 WebAssembly 时,Web 浏览器仅支持 Javascript。WebAssembly 于 2017 年首次发布,到 2019 年迅速成为了 W3C 的官方标准,它包括一种人类可读的 .wat 文本格式语言,然后将其转换为浏览器可以运行的二进制 .wasm 格式,这就使得我们可以用任何语言编写代码,将其编译为 WebAssembly,然后在网络浏览器中运行。
<!DOCTYPE html>
<html lang="en">
  <head>
    <meta charset="utf-8" />
    <meta name="viewport" content="width=device-width,initial-scale=1" />

    <title>PyScript Hello World</title>

    <link rel="icon" type="image/png" href="favicon.png" />
    <link rel="stylesheet" href="https://pyscript.net/alpha/pyscript.css" />
    <script defer src="https://pyscript.net/alpha/pyscript.js"></script>
  </head>

  <body>
    Hello world! <br />
    This is the current date and time, as computed by Python:
    <py-script>
from datetime import datetime
now = datetime.now()
now.strftime("%m/%d/%Y, %H:%M:%S")
    </py-script>
  </body>
</html>
只需要这页面上显示当前时间即可,在浏览器中打开后就可以看到结果了,如下所示: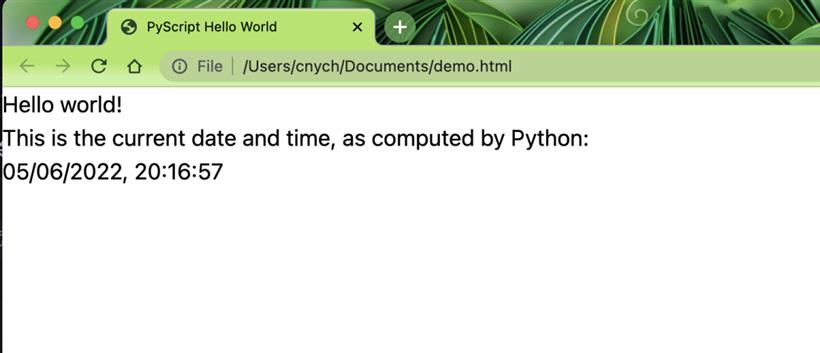
<!DOCTYPE html>
<html lang="en">
  <head>
    <meta charset="utf-8">
    <link rel="icon" type="image/x-icon" href="./favicon.png">
    <meta name="apple-mobile-web-app-capable" content="yes">
    <meta name="apple-mobile-web-app-status-bar-style" content="default">
    <meta name="theme-color" content="#000000">
    <meta name="name" content="PyScript/Panel Streaming Demo">

    <title>PyScript/Panel Streaming Demo</title>
    <link rel="icon" type="image/x-icon" href="./favicon.ico">

    <link rel="stylesheet" href="https://cdnjs.cloudflare.com/ajax/libs/font-awesome/5.15.3/css/all.min.css" type="text/css" />
    <link rel="stylesheet" href="https://unpkg.com/@holoviz/panel@0.13.0/dist/css/widgets.css" type="text/css" />
    <link rel="stylesheet" href="https://unpkg.com/@holoviz/panel@0.13.0/dist/css/markdown.css" type="text/css" />

    <script type="text/javascript" src="https://unpkg.com/tabulator-tables@4.9.3/dist/js/tabulator.js"></script>
    <script type="text/javascript" src="https://cdn.bokeh.org/bokeh/release/bokeh-2.4.2.js"></script>
    <script type="text/javascript" src="https://cdn.bokeh.org/bokeh/release/bokeh-widgets-2.4.2.min.js"></script>
    <script type="text/javascript" src="https://cdn.bokeh.org/bokeh/release/bokeh-tables-2.4.2.min.js"></script>
    <script type="text/javascript" src="https://unpkg.com/@holoviz/panel@0.13.0/dist/panel.min.js"></script>
    <script type="text/javascript">
      Bokeh.set_log_level("info");
    </script>

    <link rel="stylesheet" href="https://cdn.jsdelivr.net/npm/bootstrap@4.6.1/dist/css/bootstrap.min.css">
    <link rel="stylesheet" href="https://unpkg.com/@holoviz/panel@0.13.0/dist/bundled/bootstraptemplate/bootstrap.css">
    <link rel="stylesheet" href="https://unpkg.com/@holoviz/panel@0.13.0/dist/bundled/defaulttheme/default.css">

    <script src="https://cdn.jsdelivr.net/npm/jquery@3.5.1/dist/jquery.slim.min.js"></script>
    <script src="https://cdn.jsdelivr.net/npm/bootstrap@4.6.1/dist/js/bootstrap.bundle.min.js"></script>

    <link rel="stylesheet" href="https://pyscript.net/alpha/pyscript.css" />
    <script defer src="https://pyscript.net/alpha/pyscript.js"></script>
  </head>

  <py-env>
  - bokeh
  - numpy
  - pandas
  - panel
  </py-env>

  <body>
    <div class="container-fluid d-flex flex-column vh-100 overflow-hidden" id="container">
      <nav class="navbar navbar-expand-md navbar-dark sticky-top shadow" id="header" style="background-color: #000000;">
        <button type="button" class="navbar-toggle collapsed" id="sidebarCollapse">
   <span class="navbar-toggler-icon"></span>
 </button>
 <div class="app-header">
   <a class="navbar-brand app-logo" href="/">
     <img src="./logo.png" class="app-logo">
   </a>
   <a class="title" href="" style="color: #f0ab3c;">Panel Streaming Demo</a>
 </div>
      </nav>

      <div class="row overflow-hidden" id="content">
        <div class="col mh-100 float-left" id="main">
          <div class="bk-root" id="controls"></div>
          <div class="row">
            <div class="bk-root" id="table"></div>
            <div class="bk-root" id="plot"></div>
          </div>
        </div>
      </div>
    </div>
    <py-script>
import asyncio

import panel as pn
import numpy as np
import pandas as pd

from bokeh.models import ColumnDataSource
from bokeh.plotting import figure
from panel.io.pyodide import show

df = pd.DataFrame(np.random.randn(10, 4), columns=list('ABCD')).cumsum()

rollover = pn.widgets.IntInput(name='Rollover', value=15)
follow = pn.widgets.Checkbox(name='Follow', value=True, align='end')

tabulator = pn.widgets.Tabulator(df, height=450, width=400)

def color_negative_red(val):
    """
    Takes a scalar and returns a string with
    the css property `'color: red'` for negative
    strings, black otherwise.
    """
    color = 'red' if val < 0 else 'green'
    return 'color: %s' % color

tabulator.style.applymap(color_negative_red)

p = figure(height=450, width=600)

cds = ColumnDataSource(data=ColumnDataSource.from_df(df))

p.line('index', 'A', source=cds, line_color='red')
p.line('index', 'B', source=cds, line_color='green')
p.line('index', 'C', source=cds, line_color='blue')
p.line('index', 'D', source=cds, line_color='purple')

def stream():
    data = df.iloc[-1] + np.random.randn(4)
    tabulator.stream(data, rollover=rollover.value, follow=follow.value)
    value = {k: [v] for k, v in tabulator.value.iloc[-1].to_dict().items()}
    value['index'] = [tabulator.value.index[-1]]
    cds.stream(value)

cb = pn.state.add_periodic_callback(stream, 200)

controls = pn.Row(cb.param.period, rollover, follow, width=400)

await show(controls, 'controls')
await show(tabulator, 'table')
await show(p, 'plot')
    </py-script>
  </body>
</html>
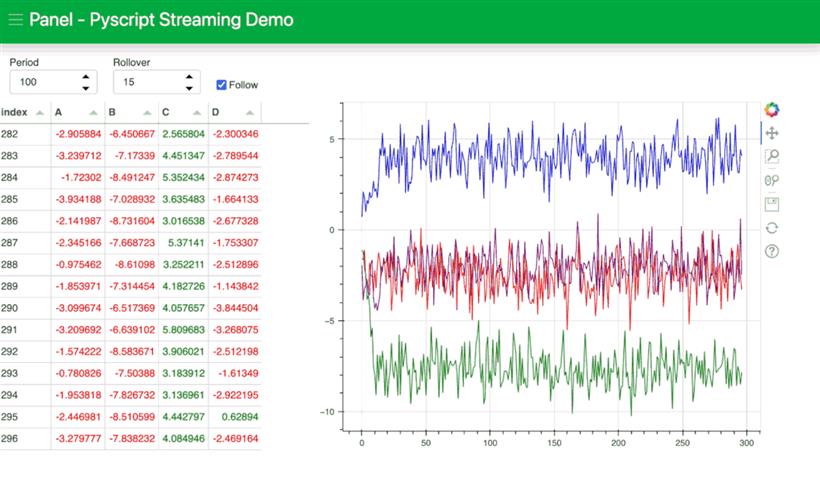
上面的代码在浏览器中打开后就可以直接显示对应的效果了: