

- 联系我们
- duidaima.com 版权声明
- 闽ICP备2020021581号
-
 闽公网安备 35020302035485号
闽公网安备 35020302035485号

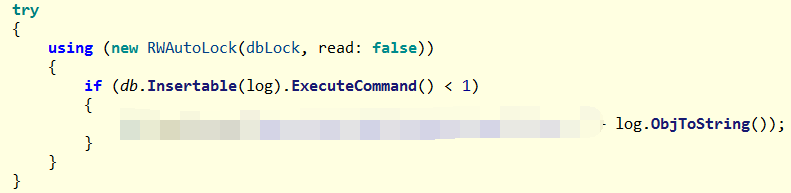
// 堆代码 duidaima.com
0:000:x86> !clrstack
OS Thread Id: 0x4a08 (0)
Child SP       IP Call Site
012fe784 0000002b [HelperMethodFrame_1OBJ: 012fe784] System.Threading.WaitHandle.WaitOneNative(System.Runtime.InteropServices.SafeHandle, UInt32, Boolean, Boolean)
012fe868 7115d952 System.Threading.WaitHandle.InternalWaitOne(System.Runtime.InteropServices.SafeHandle, Int64, Boolean, Boolean) [f:\dd\ndp\clr\src\BCL\system\threading\waithandle.cs @ 243]
012fe880 7115d919 System.Threading.WaitHandle.WaitOne(Int32, Boolean) [f:\dd\ndp\clr\src\BCL\system\threading\waithandle.cs @ 194]
012fe894 711e89bf System.Threading.WaitHandle.WaitOne(Int32) [f:\dd\ndp\clr\src\BCL\system\threading\waithandle.cs @ 220]
012fe89c 6fb186b8 System.Threading.ReaderWriterLockSlim.WaitOnEvent(System.Threading.EventWaitHandle, UInt32 ByRef, TimeoutTracker, EnterLockType)
012fe8e0 6fb17892 System.Threading.ReaderWriterLockSlim.TryEnterReadLockCore(TimeoutTracker)
012fe920 6fb17562 System.Threading.ReaderWriterLockSlim.TryEnterReadLock(TimeoutTracker)
012fe94c 0325f49f xxx.QuyitpjK0dXKR6IyqH(System.Object)
012fe964 0325ee8a xxx.RWAutoLock..ctor(System.Threading.ReaderWriterLockSlim, Boolean)
...
从卦中的线程栈数据来看,貌似是卡在一个读写锁TryEnterReadLock 上,根据读写锁的规则,必然有人执行了一个 WriteLock 并且出不来,接下来就是寻找持有这个 lock 的线程。
0:000:x86> !DumpObj /d 03526f38
Name:        System.Threading.ReaderWriterLockSlim
MethodTable: 6f947428
EEClass:     6f9a92dc
Size:        72(0x48) bytes
File:        C:\Windows\Microsoft.Net\assembly\GAC_MSIL\System.Core\v4.0_4.0.0.0__b77a5c561934e089\System.Core.dll
Fields:
      MT    Field   Offset                 Type VT     Attr    Value Name
70da878c  40004aa       38       System.Boolean  1 instance        0 _fIsReentrant
6f92fa28  40004ab       3c ...LockSlim+SpinLock  1 instance 03526f74 _spinLock
70dfba4c  40004ac       1c        System.UInt32  1 instance       20 _numWriteWaiters
70dfba4c  40004ad       20        System.UInt32  1 instance        1 _numReadWaiters
70dfba4c  40004ae       24        System.UInt32  1 instance        0 _numWriteUpgradeWaiters
70dfba4c  40004af       28        System.UInt32  1 instance        0 _numUpgradeWaiters
6f93d764  40004b0       39          System.Byte  1 instance        0 _waiterStates
70da42a8  40004b1       2c         System.Int32  1 instance       -1 _upgradeLockOwnerId
70da42a8  40004b2       30         System.Int32  1 instance       11 _writeLockOwnerId
70da6924  40004b3        c ...g.EventWaitHandle  0 instance 034844d0 _writeEvent
70da6924  40004b4       10 ...g.EventWaitHandle  0 instance 042a69c8 _readEvent
70da6924  40004b5       14 ...g.EventWaitHandle  0 instance 00000000 _upgradeEvent
70da6924  40004b6       18 ...g.EventWaitHandle  0 instance 00000000 _waitUpgradeEvent
70da150c  40004b8        4         System.Int64  1 instance 367 _lockID
70da878c  40004ba       3a       System.Boolean  1 instance        0 _fUpgradeThreadHoldingRead
70dfba4c  40004bc       34        System.UInt32  1 instance 3221225472 _owners
70da878c  40004c2       3b       System.Boolean  1 instance        0 _fDisposed
70da42a8  40004a9      4dc         System.Int32  1   static        4 ProcessorCount
70da150c  40004b7      4d4         System.Int64  1   static 1882 s_nextLockID
6f942b7c  40004b9        0 ...ReaderWriterCount  0 TLstatic  t_rwc
结合源码分析,发现上面的 _writeLockOwnerId=11 就是持有锁的线程ID,找到持有线程就好办了,把这个 managedid=11 转成 dbgid 再观察。0:000:x86> !t 13 11 47bc 0a0702c0 1029220 Preemptive 00000000:00000000 01425ed0 0 MTA (Threadpool Worker) 0:013:x86> !clrstack OS Thread Id: 0x47bc (13) Child SP IP Call Site 07e4f1ac 0000002b [InlinedCallFrame: 07e4f1ac] 07e4f1a4 09e38597 DomainBoundILStubClass.IL_STUB_PInvoke(IntPtr) 07e4f1ac 09e38334 [InlinedCallFrame: 07e4f1ac] System.Data.SQLite.UnsafeNativeMethods.sqlite3_step(IntPtr) 07e4f1dc 09e38334 System.Data.SQLite.SQLite3.Step(System.Data.SQLite.SQLiteStatement) 07e4f228 09e36fe8 System.Data.SQLite.SQLiteDataReader.NextResult() 07e4f250 09e36ceb System.Data.SQLite.SQLiteDataReader..ctor(System.Data.SQLite.SQLiteCommand, System.Data.CommandBehavior) 07e4f270 09e367ce System.Data.SQLite.SQLiteCommand.ExecuteReader(System.Data.CommandBehavior) 07e4f284 09e36732 System.Data.SQLite.SQLiteCommand.ExecuteNonQuery(System.Data.CommandBehavior) 07e4f2b0 09e366e6 System.Data.SQLite.SQLiteCommand.ExecuteNonQuery() 07e4f2bc 09e350dc SqlSugar.AdoProvider.ExecuteCommand(System.String, SqlSugar.SugarParameter[]) 07e4f388 13189518 SqlSugar.InsertableProvider`1[[System.__Canon, mscorlib]].ExecuteCommand() 07e4f420 0181ac4a xxx.OperateLog+d__8.MoveNext() ... 0:013:x86> k CvRegToMachine(x86) conversion failure for 0x14f X86MachineInfo::SetVal: unknown register 0 requested # ChildEBP RetAddr 00 07e4ede0 76c9ad10 ntdll_76ed0000!NtFlushBuffersFile+0xc 01 07e4ede0 6b27af8c KERNELBASE!FlushFileBuffers+0x30 WARNING: Stack unwind information not available. Following frames may be wrong. 02 07e4edf0 6b270256 SQLite_Interop!SI768767362ea03a94+0xf73c 03 07e4ee1c 6b267938 SQLite_Interop!SI768767362ea03a94+0x4a06 04 07e4ee38 6b2599e1 SQLite_Interop!SI83d1cf4976f57337+0x84c8 05 07e4ee80 6b25902b SQLite_Interop!SIa3401e98cbad673e+0x3201 06 07e4ee98 6b25258c SQLite_Interop!SIa3401e98cbad673e+0x284b 07 07e4f168 6b255a05 SQLite_Interop!SI327cfc7a6b1fd1fb+0x633c 08 07e4f19c 09e38597 SQLite_Interop!SI9c6d7cd7b7d38055+0x255结合卦中的读写信息,大概知道了原来是用写锁来写sqlite,后者卡在缓冲区刷新函数 NtFlushBuffersFile 上,方法签名如下:
NTSTATUS NtFlushBuffersFile(
  HANDLE  FileHandle,
  IO_STATUS_BLOCK *IoStatusBlock
);
有些朋友可能想看一下到底怎么写的,那就简单的反编译一下代码:
0:013:x86> uf ntdll_76ed0000!NtFlushBuffersFile
ntdll_76ed0000!NtFlushBuffersFile:
76f41ad0 b84b000000      mov     eax,4Bh
76f41ad5 ba7071f576      mov     edx,offset ntdll_76ed0000!Wow64SystemServiceCall (76f57170)
76f41ada ffd2            call    edx
76f41adc c20800          ret     8

0:013:x86> u 76F57170h
ntdll_76ed0000!Wow64SystemServiceCall:
76f57170 ff252892ff76    jmp     dword ptr [ntdll_76ed0000!Wow64Transition (76ff9228)]

0:013:x86> u 76ec7000
wow64cpu!KiFastSystemCall:
76ec7000 ea0970ec763300  jmp     0033:76EC7009
76ec7007 0000            add     byte ptr [eax],al
76ec7009 41              inc     ecx
76ec700a ffa7f8000000    jmp     dword ptr [edi+0F8h]
从汇编代码看,NtFlushBuffersFile 通过 KiFastSystemCall 进入内核态了,用户态dump是没法看内核态的,所以也无法继续追究下去。不过也可以看下这个线程过往的 GetLastError() 值,可能有些收获,使用 !gle 命令。
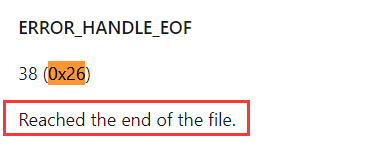
0:013:x86> !gle
LastErrorValue: (Win32) 0x26 (38) - <Unable to get error code text>
LastStatusValue: (NTSTATUS) 0xc0000008 - <Unable to get error code text>
根据上面的状态码,去msdn上搜一下具体信息。

2.删掉读写控制