
- 联系我们
- duidaima.com 版权声明
- 闽ICP备2020021581号
-
 闽公网安备 35020302035485号
闽公网安备 35020302035485号

package main

import (
 "bytes"
 "fmt"
 "log"
 "os/exec"
)
// 堆代码 duidaima.com
func main() {
 var output bytes.Buffer
 cmd := exec.Command("top", "-b", "-n", "1")
 cmd.Stdout = &output
 err := cmd.Run()
 if err != nil {
  log.Fatal(err)
 } else {
  fmt.Printf("top result: \n%v\n", output.String())
 }
}
执行命令:$ go run main.go
top result:
top - 15:07:24 up 1 day, 1:13, 0 users, load average: 0.00, 0.00, 0.00
Tasks: 24 total, 1 running, 23 sleeping, 0 stopped, 0 zombie
%Cpu(s): 0.1 us, 0.1 sy, 0.0 ni, 99.8 id, 0.0 wa, 0.0 hi, 0.0 si, 0.0 st
KiB Mem : 8056768 total, 5245460 free, 750332 used, 2060976 buff/cache
KiB Swap: 2097152 total, 2097152 free, 0 used. 7003500 avail Mem
PID USER PR NI VIRT RES SHR S %CPU %MEM TIME+ COMMAND
1 root 20 0 2324 1708 1600 S 0.0 0.0 0:01.13 init(Ubunt+
4 root 20 0 2948 308 68 S 0.0 0.0 6:34.42 init
...
20997 someone 20 0 19680 9512 5420 S 0.0 0.1 0:00.30 zsh
29176 someone 20 0 1610576 21080 9272 S 0.0 0.3 0:00.09 go
29268 someone 20 0 711488 3008 872 S 0.0 0.0 0:00.00 main
29273 someone 20 0 29444 3656 3228 R 0.0 0.0 0:00.00 top
从输出的结果中可以看到,虽然上面的方法可以获取到 CPU 相关数据,但是输出结果仅仅只是便于人眼阅读,如果我们希望将相关数据值单独取出来在程序中使用, 就需要基于结果字符串进行解析操作,这个过程就会非常麻烦而且容易出错,所以我们需要一个更好的方案。和 /proc/stat 提供的数据类似,但是数据对应的是单个进程。
$ cat /proc/stat

# 笔者的测试机器输出如下
cpu  40493 6954 65486 76990150 9113 0 25483 0 0 0
cpu0 5181 995 9564 9615416 1201 0 20111 0 0 0

...

cpu7 4382 609 7231 9627991 626 0 203 0 0 0
intr 11137544 0 0 0 0 0 0 0 0 0 0 0 0 0 0 0 0 0 0 0 0 0 0 0 0 1 1310 0 181 1 1 10 0 3 0 3 0 77853 0 1408 0 1408 0 0 0 0 0 0 0 0 0 0 0 0 0 0 0 0 0 0 0 0 0 0 0 0 0 0 0 0 0 0 0 0 0 0 0 0 0 0 0 0 0 0 0 0 0 0 0 0 0 0 0 0 0 0 0 0 0 0 0 0 0 0 0 0 0 0
0 0 0 0 0 0 0 0 0 0 0 0 0 0 0 0 0 0 0 0 0 0 0 0 0 0 0 0 0 0 0 0 0 0 0 0 0 0 0 0 0 0 0 0 0 0 0 0 0 0 0 0 0 0 0 0 0 0 0 0 0 0 0 0 0 0 0 0 0 0 0 0 0 0 0 0 0 0 0 0 0 0 0 0 0 0 0 0 0 0 0 0 0 0 0 0 0 0 0 0 0 0 0 0 0 0 0 0 0 0 0 0 0 0 0 0 0 0 0 0 0 0
0 0 0 0 0 0 0 0 0 0 0 0 0 0 0 0 0 0 0 0 0 0 0 0 0 0 0 0 0 0 0 0 0 0 0 0 0 0 0 0 0 0 0 0 0 0 0 0 0 0 0 0 0 0 0 0 0 0 0 0 0 0 0 0 0 0 0 0 0 0 0 0 0 0 0 0 0 0 0 0 0 0 0 0 0 0 0 0 0 0 0 0 0 0 0 0 0 0 0 0 0 0 0 0 0 0 0 0 0 0 0 0 0 0 0 0 0 0 0 0 0 0
0 0 0 0 0 0 0 0 0 0 0 0 0 0 0 0 0 0 0 0 0 0 0 0 0 0 0 0 0 0 0 0 0 0 0 0 0 0 0 0 0 0 0 0 0 0 0 0 0 0 0 0 0 0 0 0 0 0 0 0 0 0 0 0 0 0 0 0 0 0 0 0 0 0 0 0 0 0 0 0 0 0 0 0 0 0 0 0 0 0 0 0 0 0 0 0 0 0 0 0 0 0 0 0 0 0 0 0 0 0 0 0 0 0 0 0 0 0 0 0 0 0
0 0 0 0 0 0 0 0 0 0 0 0 0 0 0
ctxt 37107675
btime 1694670818
processes 276043
procs_running 1
procs_blocked 0
softirq 21005941 0 2478101 7 16554 0 0 3790140 6921044 0 7800095
然后再对照看一下 /proc/stat 对应的文档:
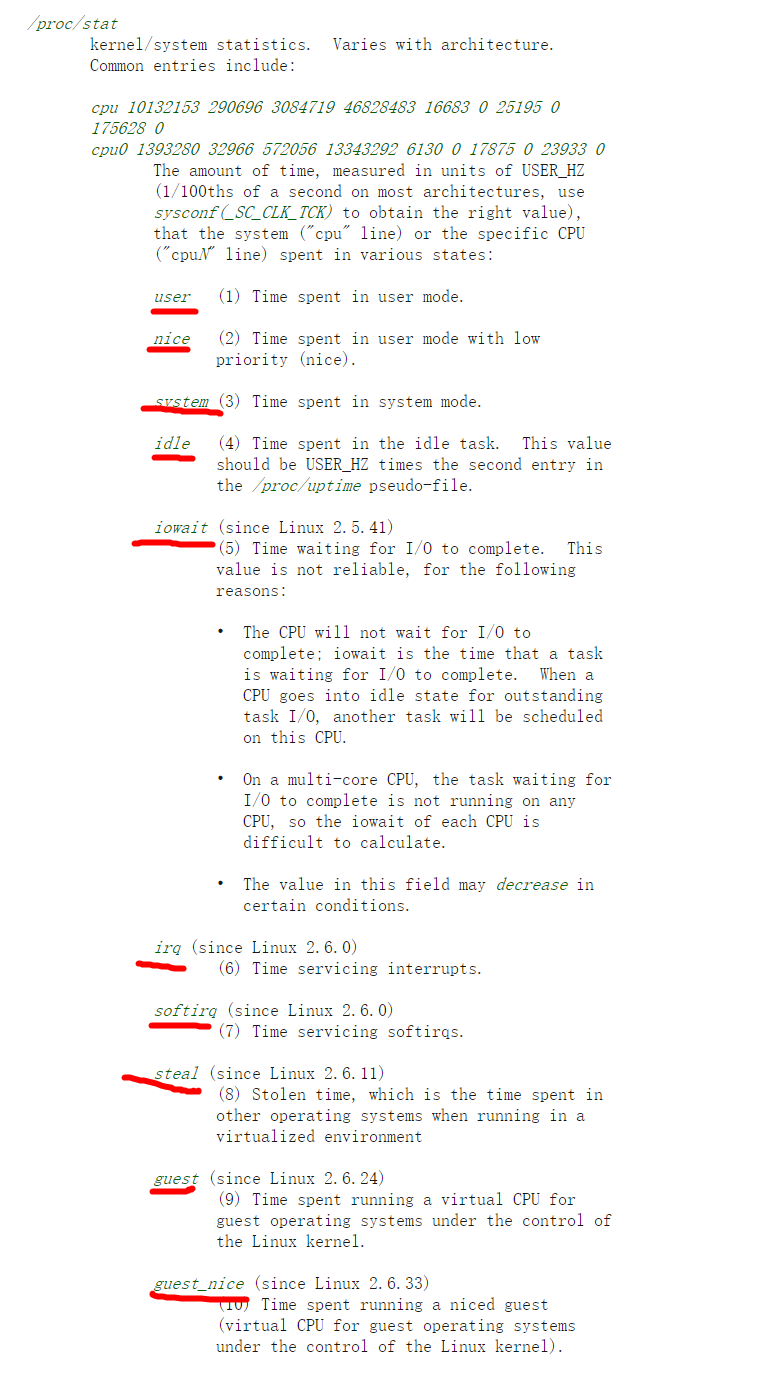
| 列序号 | 名称 | 描述 |
|---|---|---|
| 1 | user | 用户态 CPU 时间 |
| 2 | nice | 低优先级用户态 CPU 时间 (进程的 nice 值被调整为 1-19 之间) |
| 3 | system | 内核态 CPU 时间 |
| 4 | idle | CPU 空闲时间 (不包括 IO 等待时间) |
| 5 | iowait | 等待 I/O 的 CPU 时间 |
| 6 | irq | 处理硬中断的 CPU 时间 |
| 7 | softirq | 处理软中断的 CPU 时间 |
| 8 | steal | 当系统运行在虚拟机中的时候,被其他虚拟机占用的 CPU 时间 |
| 9 | guest | 通过虚拟化运行其他操作系统的时间 |
| 10 | guest_nice | 低优先级运行虚拟机的时间 |
| 字段 | 作用 |
|---|---|
| intr | 系统中断相关数据 |
| ctxt | 系统上下文切换次数 |
| btime | 系统启动以来的时间 |
| processes | 创建的进程数量 |
| procs_running | 运行进程数量 |
| procs_blocked | 阻塞进程数量 |
| softirq | 不同类型软中断的处理次数 |
package main

import (
 "fmt"
 "log"
 "math"
 "math/rand"
 "os"
 "strconv"
 "strings"
 "time"
)

const (
 cpuStatFile = "/proc/stat"
)

// 采样结果对象
type result struct {
 used uint64 // CPU 使用时间
 idle uint64 // CPU 闲置时间
}

// CPU 指标采样函数
func sample() (*result, error) {
 data, err := os.ReadFile(cpuStatFile)
 if err != nil {
  return nil, err
 }

 res := &result{}

 lines := strings.Split(string(data), "\n")
 for _, line := range lines {
  fields := strings.Fields(line)
  // 为了简化演示
  // 这里只取所有 CPU 总的统计数据
  if len(fields) == 0 || fields[0] != "cpu" {
   continue
  }

  // 将第一行数据分割为数组
  n := len(fields)
  for i := 1; i < n; i++ {
   if i > 8 {
    continue
   }

   // 解析每一列的数值
   val, err := strconv.ParseUint(fields[i], 10, 64)
   if err != nil {
    return nil, err
   }

   // 第 4 列表示 CPU 空闲时间
   // 第 5 列表示 等待 I/O 的 CPU 时间
   if i == 4 || i == 5 {
    res.idle += val
   } else {
    res.used += val
   }
  }

  return res, nil
 }

 return res, nil
}

func main() {
 // 获取第一次采样结果
 first, err := sample()
 if err != nil {
  log.Fatal(err)
 }

 // 模拟一些 CPU 密集型任务
 rand.Seed(time.Now().UnixNano())
 for i := 0; i < 10000; i++ {
  _ = math.Sqrt(rand.Float64())
 }

 // 获取第二次采样结果
 second, err := sample()
 if err != nil {
  log.Fatal(err)
 }

 // 计算两次采样期间 CPU 的空闲时间
 idle := float64(second.idle - first.idle)
 // 计算两次采样期间 CPU 的使用时间
 used := float64(second.used - first.used)
 // CPU 利用率 = CPU 使用时间 / (CPU 闲置时间 + CPU 使用时间)
 var usage float64
 if idle+used > 0 {
  usage = used / (idle + used) * 100
 }

 fmt.Printf("CPU usage is %f%%\n", usage)
}
运行上面的代码$ go run main.go CPU usage is 32.558140%上面的代码演示了如何获取系统中所有 CPU 总的利用率,感兴趣的读者可以在这个代码基础上进行改进,实现获取单个 CPU 的利用率。
package main

import (
 "fmt"
 "github.com/shirou/gopsutil/v3/cpu"
 "log"
 "math"
 "math/rand"
 "time"
)

func main() {
 done := make(chan struct{})

 go func() {
  for i := 0; i < 5; i++ {
   // 获取 CPU 利用率 (每 100 毫秒获取一次)
   percent, err := cpu.Percent(100*time.Millisecond, false)
   if err != nil {
    log.Fatalf("get CPU usage: %v\n", err)
    return
   }

   for _, v := range percent {
    fmt.Printf("CPU usage is %.2f%%\n", v)
   }
  }

  // 模拟程序结束后通过 channel 发送通知
  done <- struct{}{}
 }()

 // 模拟一些 CPU 密集型任务
 rand.Seed(time.Now().UnixNano())
 for i := 0; i < 10000000; i++ {
  _ = math.Sqrt(rand.Float64())
 }

 <-done
 close(done)
}
运行上面的代码$ go run main.go CPU usage is 32.558140% CPU usage is 12.35% CPU usage is 5.00% CPU usage is 0.00% CPU usage is 0.00% CPU usage is 0.00%最后,我们追踪下 gopsutil 源代码的调用链路,学习一下内部的实现细节。
type TimesStat struct {
 CPU       string  `json:"cpu"`
 User      float64 `json:"user"`
 System    float64 `json:"system"`
 Idle      float64 `json:"idle"`
 Nice      float64 `json:"nice"`
 Iowait    float64 `json:"iowait"`
 Irq       float64 `json:"irq"`
 Softirq   float64 `json:"softirq"`
 Steal     float64 `json:"steal"`
 Guest     float64 `json:"guest"`
 GuestNice float64 `json:"guestNice"`
}
Percent 方法// https://github.com/shirou/gopsutil/blob/2fabf15a16dca198f735a5de2722158576e986a9/cpu/cpu.go#L148
// Percent 方法计算 CPU 利用率
// 可以计算总的 CPU 利用率,也可以计算单个 CPU 的利用率 (取决于第二个参数)
// 在刚才的例子中,我们计算的是总的 CPU 利用率
func Percent(interval time.Duration, percpu bool) ([]float64, error) {
return PercentWithContext(context.Background(), interval, percpu)
}
// Percent 方法的内部具体实现
func PercentWithContext(ctx context.Context, interval time.Duration, percpu bool) ([]float64, error) {
...
// 第一次采样
cpuTimes1, err := TimesWithContext(ctx, percpu)
if err != nil {
return nil, err
}
// 获取指标的间隔时间
// 期间直接进入休眠
if err := common.Sleep(ctx, interval); err != nil {
return nil, err
}
// 第二次采样
cpuTimes2, err := TimesWithContext(ctx, percpu)
if err != nil {
return nil, err
}
// 根据两次采样数据计算出 CPU 利用率
return calculateAllBusy(cpuTimes1, cpuTimes2)
}
TimesWithContextfunc TimesWithContext(ctx context.Context, percpu bool) ([]TimesStat, error) {
// 获取对应的指标数据文件名称,也就是 /proc/stat
filename := common.HostProc("stat")
lines := []string{}
if percpu {
// 获取单个 CPU 数据
...
} else {
// 获取总的 CPU 数据
lines, _ = common.ReadLinesOffsetN(filename, 0, 1)
}
ret := make([]TimesStat, 0, len(lines))
for _, line := range lines {
// 将 /proc/stat 文件中的单行文本数据解析为 TimesStat 指标对象
ct, err := parseStatLine(line)
if err != nil {
continue
}
ret = append(ret, *ct)
}
return ret, nil
}
calculateAllBusyfunc calculateAllBusy(t1, t2 []TimesStat) ([]float64, error) {
...
ret := make([]float64, len(t1))
for i, t := range t2 {
ret[i] = calculateBusy(t1[i], t)
}
return ret, nil
}
// 堆代码 duidaima.com
func calculateBusy(t1, t2 TimesStat) float64 {
t1All, t1Busy := getAllBusy(t1)
t2All, t2Busy := getAllBusy(t2)
...
return math.Min(100, math.Max(0, (t2Busy-t1Busy)/(t2All-t1All)*100))
}
func getAllBusy(t TimesStat) (float64, float64) {
busy := t.User + t.System + t.Nice + t.Iowait + t.Irq +
t.Softirq + t.Steal
return busy + t.Idle, busy
}
从上面的代码可以看到,calculateBusy 方法内部的计算公式为: