
- 联系我们
- duidaima.com 版权声明
- 闽ICP备2020021581号
-
 闽公网安备 35020302035485号
闽公网安备 35020302035485号

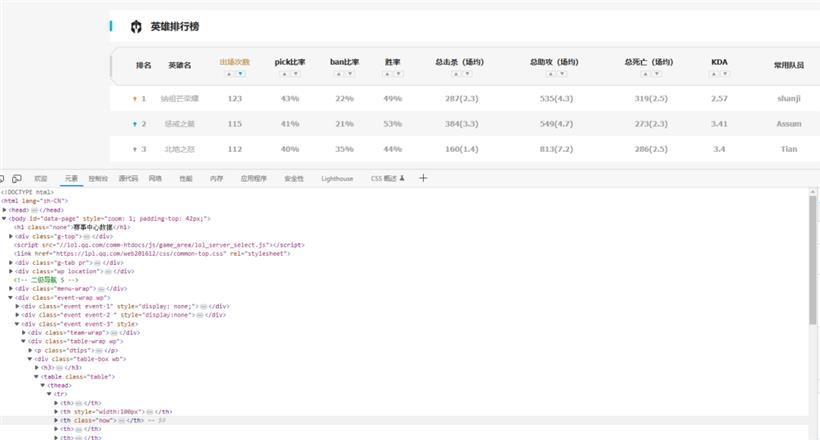

url = 'https://game.gtimg.cn/images/lol/act/img/js/heroList/hero_list.js'
headers = {'Referer': 'https://lol.qq.com/data/info-heros.shtml'}
r = requests.get(url, headers=headers)
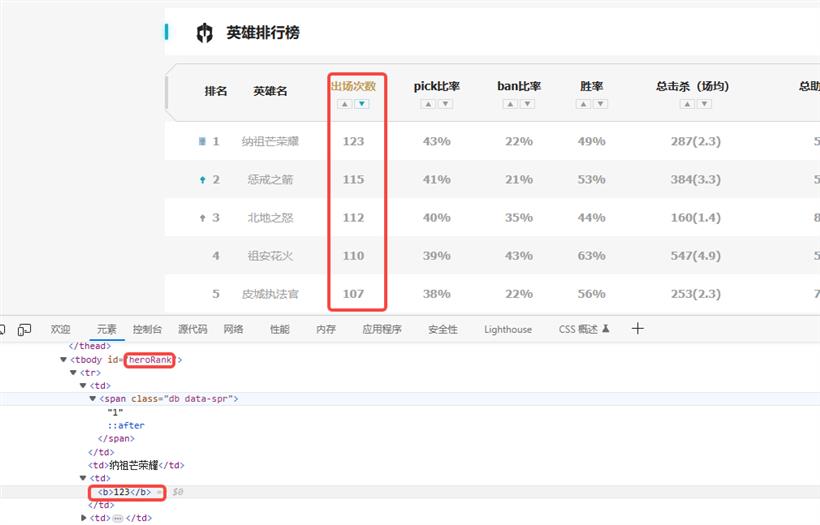
data = r.json()['hero']
hero_played_num = [{'name': item['name'], 'played_num': item['heroId'][-3:]} for item in data]
sorted_hero_played_num = sorted(hero_played_num, key=lambda x: int(x['played_num']), reverse=True)[:20]
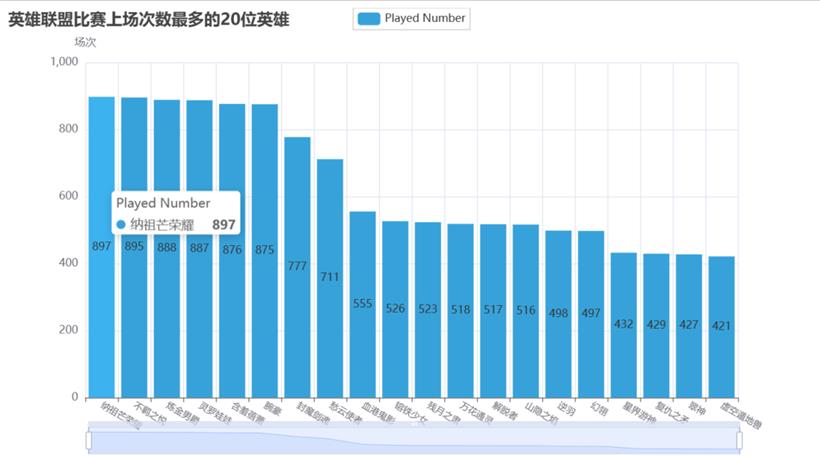
# 用pyecharts制作柱状图
bar = Bar(init_opts=opts.InitOpts(theme=ThemeType.LIGHT))
bar.add_xaxis([item['name'] for item in sorted_hero_played_num])
bar.add_yaxis('Played Number', [int(item['played_num']) for item in sorted_hero_played_num])
bar.set_global_opts(title_opts=opts.TitleOpts(title="英雄联盟比赛上场次数最多的20位英雄"),
xaxis_opts=opts.AxisOpts(axislabel_opts=opts.LabelOpts(rotate=-30, font_size=10)),
yaxis_opts=opts.AxisOpts(name="场次", axislabel_opts=opts.LabelOpts(font_size=12)),
datazoom_opts=opts.DataZoomOpts())
bar.render('lol_played_top_20.html')