
- 联系我们
- duidaima.com 版权声明
- 闽ICP备2020021581号
-
 闽公网安备 35020302035485号
闽公网安备 35020302035485号

4.以及在处理非常小的代码库时,可以使用的一个示例
更好的用户体验:快速的软件能直接提升用户满意度
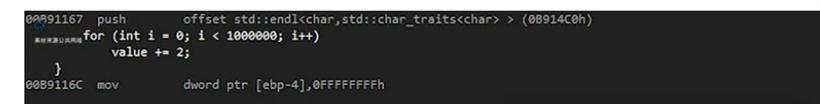
插桩型性能分析器:为每个函数调用和代码块捕获详细且准确的数据,提供更精确结果,但开销较高,不适合生产环境。例如包括 GNU 性能分析器(gprof)、Callgrind、Tracy、Remotery 和 Microprofile。
低粒度:采样型工具给出相对来说比较低粒度的数据,重点把注意力放在函数级别的信息上面。这种办法对于长时间运转的应用程序是合适的,不过呢可能没办法及时察觉到短生命周期函数里存在的问题。
成本:是否免费使用或在前需要许可证?
// main.cpp
#include <array>
#include <iostream>
#include <memory>

struct Vec3 {
    double x;
    double y;
    double z;
};

int main() {
    std::array<std::shared_ptr<Vec3>, 1000000> shared_ptrs;
    {
        std::cout << "Profiling std::make_shared \n";
        for (int i = 0; i < shared_ptrs.size(); i++)
            shared_ptrs[i] = std::make_shared<Vec3>();
    }
    {
        std::cout << "Profiling new allocation of std::shared_ptr \n";
        for (int i = 0; i < shared_ptrs.size(); i++)
            shared_ptrs[i] = std::shared_ptr<Vec3>(new Vec3());
    }
    return 0;
}
使用计时器类进行性能分析// Scoped Timer Class
#define TIMEIT() \
ScopedTimer<> timer { \
__func__ \
}
#include <chrono>
#include <iostream>
using namespace std;
template <typename Resolution = std::chrono::microseconds,
typename ClockType = std::chrono::steady_clock>
class ScopedTimer {
public:
ScopedTimer(const char* func_name) : func_name_(func_name),
start_(ClockType::now()) {}
// delete all copy, move and assignment constructors
ScopedTimer(const ScopedTimer&) = delete;
ScopedTimer& operator=(const ScopedTimer&) = delete;
ScopedTimer(ScopedTimer&&) = delete;
ScopedTimer& operator=(ScopedTimer&&) = delete;
~ScopedTimer() {
const auto& duration =
std::chrono::duration_cast<Resolution>(ClockType::now() - start_).count();
printf("%s => %lu us\n", func_name_, duration);
}
private:
const char* func_name_;
const typename ClockType::time_point start_;
};
我们现在,能够把它归入之前提及过的那些例子里;具体情况如下:{
std::cout << "Profiling std::make_shared : ";
TIMEIT();
for(int i = 0; i < shared_ptrs.size(); i++)
shared_ptrs[i] = std::make_shared<Vec3>();
}
{
std::cout << "Profiling new allocation of std::shared_ptr : ";
TIMEIT();
for(int i = 0; i < shared_ptrs.size(); i++)
shared_ptrs[i] = std::shared_ptr<Vec3>(new Vec3());
}
在编译并运行之后,我们会得到如下输出:Profiling std::make_shared:main => 37502 usProfiling new allocation of std::shared_ptr:main => 83734 us即使再多运行几次,结果也是一致的,std::make_shared的性能始终优于新分配方式。
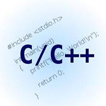
int main() {
  int value = 0;
  {
     // 堆代码 duidaima.com
    TIMEIT();
    for(int i = 0; i < 1000000; i++)
      value += 2;
  }
  std::cout << value << std::endl;
  return 0;
}
表面上看,一切似乎都显得是正确的;不过当我们进行编译并且查看这段代码的汇编之时,将会看到如下的情况: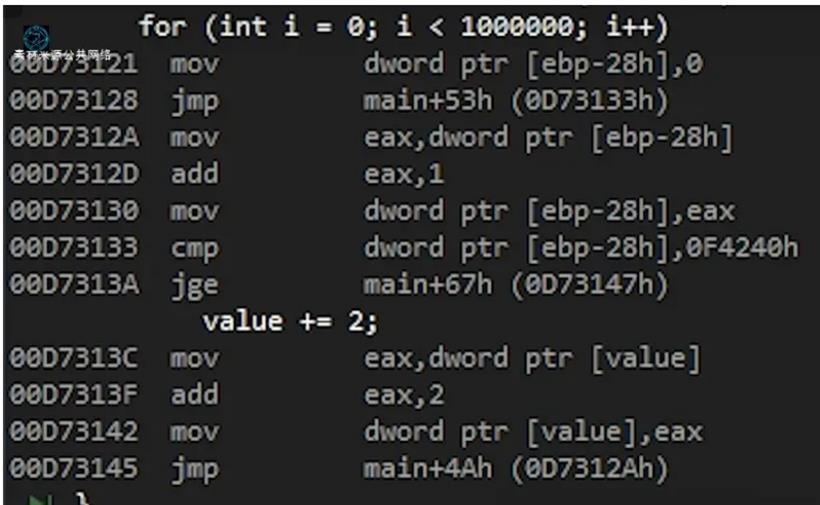
g++ -o0 -pg main.cpp -o main这会生成两个输出文件,分别是[i]主文件和[ii]“gmon.out”。
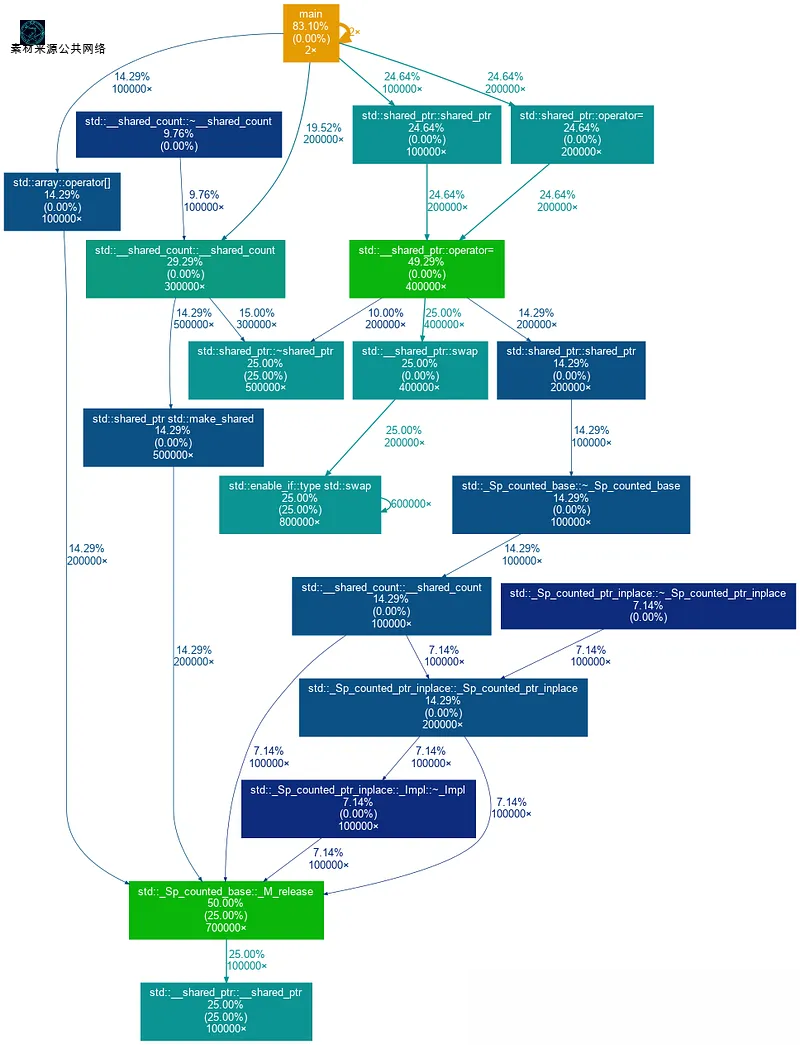
gprof main gmon.out | gprof2dot -s -w | dot -Tpng -o output.png这将为我们生成一个漂亮的执行图(如下图所示),突出显示在每个函数/代码块上花费的时间。如需查看此类图更实际示例,可以参考 gprof2dot 仓库。
多种工具一起用:有的时候,单单一种办法可能不够,所以呢可以试试多种工具,这样就能全方位地了解你的代码行为啦。