

- 联系我们
- duidaima.com 版权声明
- 闽ICP备2020021581号
-
 闽公网安备 35020302035485号
闽公网安备 35020302035485号

.测试结果呈现。
$ mvn archetype:generate \
          -DinteractiveMode=false \
          -DarchetypeGroupId=org.openjdk.jmh \
          -DarchetypeArtifactId=jmh-java-benchmark-archetype \
          -DgroupId=org.sample \
          -DartifactId=test \
          -Dversion=1.0
对应目录下会出现一个test项目,打开项目后我们会看到这样的项目结构。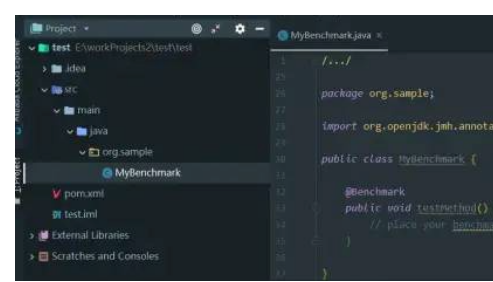
<dependency>
    <groupId>org.openjdk.jmh</groupId>
    <artifactId>jmh-core</artifactId>
    <version>${jmh.version}</version>
</dependency>
<dependency>
    <groupId>org.openjdk.jmh</groupId>
    <artifactId>jmh-generator-annprocess</artifactId>
    <version>${jmh.version}</version>
    <scope>provided</scope>
</dependency>
2. 编写性能测试/**
* 堆代码 duidaima.com
*/
@State(Scope.Benchmark)
@OutputTimeUnit(TimeUnit.SECONDS)
@Threads(Threads.MAX)
public class LinkedListIterationBenchMark {
private static final int SIZE = 10000;
private List<String> list = new LinkedList<>();
@Setup
public void setUp() {
for (int i = 0; i < SIZE; i++) {
list.add(String.valueOf(i));
}
}
@Benchmark
@BenchmarkMode(Mode.Throughput)
public void forIndexIterate() {
for (int i = 0; i < list.size(); i++) {
list.get(i);
System.out.print("");
}
}
@Benchmark
@BenchmarkMode(Mode.Throughput)
public void forEachIterate() {
for (String s : list) {
System.out.print("");
}
}
}
3. 执行测试$ mvn clean install $ java -jar target/benchmarks.jar我们日常中遇到的一般是一些小测试,比如我上面写的例子,直接在IDE中跑就好了。
public static void main(String[] args) throws RunnerException {
    Options opt = new OptionsBuilder()
            .include(LinkedListIterationBenchMark.class.getSimpleName())
            .forks(1)
            .warmupIterations(2)
            .measurementIterations(2)
         .output("E:/Benchmark.log")
            .build();

    new Runner(opt).run();
}
4. 报告结果Benchmark Mode Cnt Score Error Units LinkedListIterationBenchMark.forEachIterate thrpt 2 1192.380 ops/s LinkedListIterationBenchMark.forIndexIterate thrpt 2 206.866 ops/s整个过程:
> 基于 Spring Cloud Alibaba + Gateway + Nacos + RocketMQ + Vue & Element 实现的后台管理系统 + 用户小程序,支持 RBAC 动态权限、多租户、数据权限、工作流、三方登录、支付、短信、商城等功能
>
> * 项目地址:<https://gitee.com/zhijiantianya/yudao-cloud>
> * 视频教程:<https://doc.iocoder.cn/video/>

# Detecting actual CPU count: 12 detected
# JMH version: 1.21
# VM version: JDK 1.8.0_131, Java HotSpot(TM) 64-Bit Server VM, 25.131-b11
# VM invoker: C:\Program Files\Java\jdk1.8.0_131\jre\bin\java.exe
# VM options: -javaagent:D:\Program Files\JetBrains\IntelliJ IDEA 2018.2.2\lib\idea_rt.jar=65175:D:\Program Files\JetBrains\IntelliJ IDEA 2018.2.2\bin -Dfile.encoding=UTF-8
# Warmup: 2 iterations, 10 s each
# Measurement: 2 iterations, 10 s each
# Timeout: 10 min per iteration
# Threads: 12 threads, will synchronize iterations
# Benchmark mode: Throughput, ops/time
# Benchmark: org.sample.jmh.LinkedListIterationBenchMark.forEachIterate

# Run progress: 0.00% complete, ETA 00:01:20
# Fork: 1 of 1
# Warmup Iteration   1: 1189.267 ops/s
# Warmup Iteration   2: 1197.321 ops/s
Iteration   1: 1193.062 ops/s
Iteration   2: 1191.698 ops/s

Result "org.sample.jmh.LinkedListIterationBenchMark.forEachIterate":
  1192.380 ops/s

# JMH version: 1.21
# VM version: JDK 1.8.0_131, Java HotSpot(TM) 64-Bit Server VM, 25.131-b11
# VM invoker: C:\Program Files\Java\jdk1.8.0_131\jre\bin\java.exe
# VM options: -javaagent:D:\Program Files\JetBrains\IntelliJ IDEA 2018.2.2\lib\idea_rt.jar=65175:D:\Program Files\JetBrains\IntelliJ IDEA 2018.2.2\bin -Dfile.encoding=UTF-8
# Warmup: 2 iterations, 10 s each
# Measurement: 2 iterations, 10 s each
# Timeout: 10 min per iteration
# Threads: 12 threads, will synchronize iterations
# Benchmark mode: Throughput, ops/time
# Benchmark: org.sample.jmh.LinkedListIterationBenchMark.forIndexIterate

# Run progress: 50.00% complete, ETA 00:00:40
# Fork: 1 of 1
# Warmup Iteration   1: 205.676 ops/s
# Warmup Iteration   2: 206.512 ops/s
Iteration   1: 206.542 ops/s
Iteration   2: 207.189 ops/s

Result "org.sample.jmh.LinkedListIterationBenchMark.forIndexIterate":
  206.866 ops/s

# Run complete. Total time: 00:01:21

REMEMBER: The numbers below are just data. To gain reusable insights, you need to follow up on
why the numbers are the way they are. Use profilers (see -prof, -lprof), design factorial
experiments, perform baseline and negative tests that provide experimental control, make sure
the benchmarking environment is safe on JVM/OS/HW level, ask for reviews from the domain experts.
Do not assume the numbers tell you what you want them to tell.

Benchmark                                      Mode  Cnt     Score   Error  Units
LinkedListIterationBenchMark.forEachIterate   thrpt    2  1192.380          ops/s
LinkedListIterationBenchMark.forIndexIterate  thrpt    2   206.866          ops/s
注解介绍
:
| 类型 | 描述 |
|---|---|
| Throughput | 每段时间执行的次数,一般是秒 |
| AverageTime | 平均时间,每次操作的平均耗时 |
| SampleTime | 在测试中,随机进行采样执行的时间 |
| SingleShotTime | 在每次执行中计算耗时 |
| All | 所有模式 |
可以注释在方法级别,也可以注释在类级别。
@BenchmarkMode(Mode.All)
public class LinkedListIterationBenchMark {
 ...
}
@Benchmark
@BenchmarkMode({Mode.Throughput, Mode.SingleShotTime})
public void m() {
 ...
}
@Benchmark
@BenchmarkMode({Mode.Throughput, Mode.SingleShotTime})
@Warmup(iterations = 3)
public void m() {
 ...
}
@Measurement@Benchmark
@BenchmarkMode({Mode.Throughput, Mode.SingleShotTime})
@Measurement(iterations = 3)
public void m() {
...
}
@Threads(Threads.MAX)
public class LinkedListIterationBenchMark {
 ...
}
@Fork@Benchmark
@BenchmarkMode({Mode.Throughput, Mode.SingleShotTime})
@Fork(value = 3)
public void m() {
...
}
@OutputTimeUnit/**
* 仅限于IDE中运行
* 命令行模式 则是 build 然后 java -jar 启动
*
* 1. 这是benchmark 启动的入口
* 2. 这里同时还完成了JMH测试的一些配置工作
* 3. 默认场景下,JMH会去找寻标注了@Benchmark的方法,可以通过include和exclude两个方法来完成包含以及排除的语义
*/
public static void main(String[] args) throws RunnerException {
Options opt = new OptionsBuilder()
// 包含语义
// 可以用方法名,也可以用XXX.class.getSimpleName()
.include("Helloworld")
// 排除语义
.exclude("Pref")
// 预热10轮
.warmupIterations(10)
// 代表正式计量测试做10轮,
// 而每次都是先执行完预热再执行正式计量,
// 内容都是调用标注了@Benchmark的代码。
.measurementIterations(10)
// forks(3)指的是做3轮测试,
// 因为一次测试无法有效的代表结果,
// 所以通过3轮测试较为全面的测试,
// 而每一轮都是先预热,再正式计量。
.forks(3)
.output("E:/Benchmark.log")
.build();
new Runner(opt).run();
}