

- 联系我们
- duidaima.com 版权声明
- 闽ICP备2020021581号
-
 闽公网安备 35020302035485号
闽公网安备 35020302035485号

// 获取当前方法名
String methodName = Thread.currentThread().getStackTrace()[1].getMethodName();
// 打印当前方法名
System.out.println("当前方法名:" + methodName)
这种方法的优点是简单易用,不需要创建额外的对象。缺点是性能较低,因为 Thread.currentThread().getStackTrace() 方法获取堆栈跟踪信息需要遍历整个调用栈,而且需要保证线程安全性。// 获取当前方法名
String methodName = new Exception().getStackTrace()[0].getMethodName();
// 打印当前方法名
System.out.println("当前方法名:" + methodName);
这种方法仍然需要获取堆栈跟踪信息,而且需要创建异常对象。缺点是需要创建额外的对象,而且代码较为复杂,不太直观。// 获取当前方法名
String methodName = new Object(){}.getClass().getEnclosingMethod().getName();
// 打印当前方法名
System.out.println("当前方法名:" + methodName);
这种方法的优点是不需要获取堆栈跟踪信息,而且不会创建异常对象,因此性能和可读性都较好。缺点是需要创建额外的对象,而且代码较为复杂,不太直观。StackWalker walker = StackWalker.getInstance();
Optional<String> optional = walker.walk(frames -> frames
.findFirst()
.map(StackWalker.StackFrame::getMethodName));
System.out.println("当前方法名:" + optional.get());
首先,我们使用 StackWalker.getInstance() 工厂方法获取 StackWalker 实例。map() 方法用于获取顶部帧 StackFrame 的当前方法名称
4.无需急切地捕获整个堆栈跟踪,这可能成本很高 - Thread.currentThread()
StackWalker 是以一种懒惰的方式逐一遍历堆栈。在需要获取当前方法名称时,我们可以只获取顶部帧,而不需要捕获整个堆栈跟踪。
<?xml version="1.0" encoding="UTF-8"?>
<configuration>
    <springProperty scope="context" name="appName" source="spring.application.name" defaultValue="dev"/>
    <property name="logPath" value="/home/logs/${appName}"/>
    <property name="pattern"
              value="%d{yyyy-MM-dd HH:mm:ss.SSS} [%X{request_id}] [%thread] [%-5level] %logger{36}:%L %M - %msg%n"/>

    <!-- 控制台输出 -->
    <appender name="STDOUT" class="ch.qos.logback.core.ConsoleAppender">
        <!-- encoder 默认配置为PatternLayoutEncoder -->
        <encoder>
            <pattern>${pattern}</pattern>
        </encoder>
    </appender>
    <!-- 记录日志到文件 -->
    <appender name="INFO" class="ch.qos.logback.core.rolling.RollingFileAppender">
        <file>${logPath}/info.log</file>
        <encoder>
            <pattern>${pattern}</pattern>
        </encoder>
        <rollingPolicy class="ch.qos.logback.core.rolling.TimeBasedRollingPolicy">
            <fileNamePattern>${logPath}/run.%d{yyyy-MM-dd}.log</fileNamePattern>
        </rollingPolicy>
    </appender>
    ...
</configuration>
可以看到我们配置的日志输出格式是%d{yyyy-MM-dd HH:mm:ss.SSS} [%X{request_id}] [%thread] [%-5level] %logger{36}:%L %M - %msg%n
Logback 在打印日志时,会解析这个日志输出格式,最后将 %M 占位符替换为当前方法名称。解析日志格式的源码就在 FormattingConverter 类的 write() 方法中,write() 方法中会执行 convert() 方法,这个方法就是执行占位符替换的。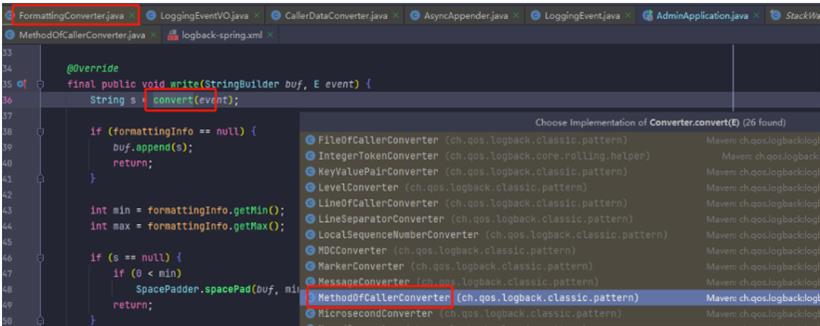
public class MethodOfCallerConverter extends ClassicConverter {
    public String convert(ILoggingEvent le) {
        StackTraceElement[] cda = le.getCallerData();
        if (cda != null && cda.length > 0) {
            // 返回当前方法名称
            return cda[0].getMethodName();
        } else {
            return CoreConstants.NA;
        }
    }
}
方法逻辑如下,StackTraceElement[] cda = le.getCallerData() 获取当前堆栈顶部帧 cda[0].getMethodName() 根据顶部帧获取当前方法名称。如上我们只需要看下 le.getCallerData() 方法的堆栈是从哪里获取来的,就能知道答案了。进入 LoggingEvent 源码类中,我们可以发现堆栈获取逻辑,源码如下:
public class LoggingEvent implements ILoggingEvent {
    public StackTraceElement[] getCallerData() {
        if (callerDataArray == null) {
            // 堆栈初始化
            callerDataArray = CallerData.extract(new Throwable(), fqnOfLoggerClass,
                    loggerContext.getMaxCallerDataDepth(), loggerContext.getFrameworkPackages());
        }
        return callerDataArray;
    }
    ...
}
通过分析源码,我们可以知道,如果当前堆栈为空,进行堆栈信息初始化。这里就可以看到堆栈信息初始化来自 extract 方法:CallerData.extract(new Throwable(), fqnOfLoggerClass,loggerContext.getMaxCallerDataDepth(), loggerContext.getFrameworkPackages())如果堆栈信息不为空,直接返回当前堆栈。这里是为了避免浪费,针对在一个方法中重复获取堆栈信息的情况。Ok,到这里离胜利就只差一步了。
public class CallerData {
    public static StackTraceElement[] extract(Throwable t, String fqnOfInvokingClass, final int maxDepth,
            List<String> frameworkPackageList) {
        if (t == null) {
            return null;
        }

        StackTraceElement[] steArray = t.getStackTrace();
        StackTraceElement[] callerDataArray;
        ...
        callerDataArray = new StackTraceElement[desiredDepth];
        for (int i = 0; i < desiredDepth; i++) {
            callerDataArray[i] = steArray[found + i];
        }
        return callerDataArray;
    }
    ...
}
为了突出源码逻辑的重点,这里我删去了一部分代码,是为了让大家更好的看清楚 Logback 中堆栈信息的初始化,其实用的就是异常对象的 getStackTrace() 方法。也就是上面源码中 StackTraceElement[] steArray = t.getStackTrace() 方法所体现的。内存 16 GB(2667 MHZ)
Warmup: 3 iterations, 10 s each
Measurement: 5 iterations, 3 s each
Timeout: 10 min per iteration
Threads: 8 threads, will synchronize iterations
Benchmark mode: Throughput
测试代码:
@BenchmarkMode(Mode.Throughput)
@Warmup(iterations = 3)
@Measurement(iterations = 5, time = 3, timeUnit = TimeUnit.SECONDS)
@Threads(8)
@Fork(2)
@OutputTimeUnit(TimeUnit.MILLISECONDS)
public class MethodNameTest {
    @Benchmark
    @BenchmarkMode({Mode.Throughput})
    public void m1() {
        // 获取当前方法名
        String methodName = Thread.currentThread().getStackTrace()[1].getMethodName();
    }

    public static void main(String[] args) throws RunnerException {
        Options opt = new OptionsBuilder()
                .include(MethodNameTest.class.getSimpleName())
                .build();

        new Runner(opt).run();
    }
}
...
# Run progress: 0.00% complete, ETA 00:06:00
# Fork: 1 of 2
# Warmup Iteration   1: 16.946 ops/ms
# Warmup Iteration   2: 17.086 ops/ms
# Warmup Iteration   3: 17.116 ops/ms
Iteration   1: 17.159 ops/ms
Iteration   2: 17.118 ops/ms
Iteration   3: 17.279 ops/ms
Iteration   4: 17.329 ops/ms
Iteration   5: 17.241 ops/ms

# Run progress: 12.50% complete, ETA 00:05:23
# Fork: 2 of 2
# Warmup Iteration   1: 16.546 ops/ms
# Warmup Iteration   2: 17.340 ops/ms
# Warmup Iteration   3: 17.431 ops/ms
Iteration   1: 17.331 ops/ms
Iteration   2: 17.099 ops/ms
Iteration   3: 17.280 ops/ms
Iteration   4: 17.511 ops/ms
Iteration   5: 17.323 ops/ms


Result "ltd.newbee.mall.MethodNameTest.m1":
  17.267 ±(99.9%) 0.184 ops/ms [Average]
  (min, avg, max) = (17.099, 17.267, 17.511), stdev = 0.122
  CI (99.9%): [17.083, 17.451] (assumes normal distribution)
上面一大堆输出信息,大家直接看重点:在最后 Result "ltd.newbee.mall.MethodNameTest.m1": 这里,平均 ops 是每毫秒 17 次,比较低。@Benchmark
@BenchmarkMode({Mode.Throughput})
public void m2() {
// 获取当前方法名
String methodName = new Throwable().getStackTrace()[0].getMethodName();
}
测试结果:... # 堆代码 duidaima.com # Run progress: 25.00% complete, ETA 00:04:37 # Fork: 1 of 2 # Warmup Iteration 1: 12.891 ops/ms # Warmup Iteration 2: 12.873 ops/ms # Warmup Iteration 3: 13.023 ops/ms Iteration 1: 25.617 ops/ms Iteration 2: 25.840 ops/ms Iteration 3: 25.301 ops/ms Iteration 4: 24.839 ops/ms Iteration 5: 25.930 ops/ms # Run progress: 37.49% complete, ETA 00:03:51 # Fork: 2 of 2 # Warmup Iteration 1: 12.511 ops/ms # Warmup Iteration 2: 12.329 ops/ms # Warmup Iteration 3: 13.011 ops/ms Iteration 1: 23.842 ops/ms Iteration 2: 24.292 ops/ms Iteration 3: 25.600 ops/ms Iteration 4: 25.745 ops/ms Iteration 5: 25.789 ops/ms Result "ltd.newbee.mall.MethodNameTest.m2": 25.280 ±(99.9%) 1.088 ops/ms [Average] (min, avg, max) = (23.842, 25.280, 25.930), stdev = 0.720 CI (99.9%): [24.191, 26.368] (assumes normal distribution)直接看最后 Result "ltd.newbee.mall.MethodNameTest.m2": 这里,平均 ops 是每毫秒 25 次,也比较低。
@Benchmark
@BenchmarkMode({Mode.Throughput})
public void m1() {
    // 获取当前方法名
    String methodName = Thread.currentThread().getStackTrace()[1].getMethodName();
}
测试结果:... # Run progress: 49.99% complete, ETA 00:03:04 # Fork: 1 of 2 # Warmup Iteration 1: 10489.110 ops/ms # Warmup Iteration 2: 9233.590 ops/ms # Warmup Iteration 3: 10504.615 ops/ms Iteration 1: 10695.898 ops/ms Iteration 2: 10570.155 ops/ms Iteration 3: 11089.810 ops/ms Iteration 4: 10805.448 ops/ms Iteration 5: 10027.222 ops/ms # Run progress: 62.49% complete, ETA 00:02:18 # Fork: 2 of 2 # Warmup Iteration 1: 11322.008 ops/ms # Warmup Iteration 2: 10025.593 ops/ms # Warmup Iteration 3: 10808.095 ops/ms Iteration 1: 10684.594 ops/ms Iteration 2: 11241.540 ops/ms Iteration 3: 10742.348 ops/ms Iteration 4: 9940.437 ops/ms Iteration 5: 11226.023 ops/ms Result "ltd.newbee.mall.MethodNameTest.m3": 10702.347 ±(99.9%) 672.631 ops/ms [Average] (min, avg, max) = (9940.437, 10702.347, 11241.540), stdev = 444.904 CI (99.9%): [10029.716, 11374.979] (assumes normal distribution)直接看最后 Result "ltd.newbee.mall.MethodNameTest.m3": 这里,平均 ops 是每毫秒 10702 次。非常夸张,可以看到 ops 对比上面两种方法一下子从几十级别提升到上万级别。
@Benchmark
@BenchmarkMode({Mode.Throughput})
public void m1() {
    // 获取当前方法名
    String methodName = Thread.currentThread().getStackTrace()[1].getMethodName();
}
测试结果:... # Run progress: 74.99% complete, ETA 00:01:32 # Fork: 1 of 2 # Warmup Iteration 1: 2191.034 ops/ms # Warmup Iteration 2: 2141.886 ops/ms # Warmup Iteration 3: 2192.843 ops/ms Iteration 1: 2262.279 ops/ms Iteration 2: 2263.193 ops/ms Iteration 3: 2201.354 ops/ms Iteration 4: 2282.906 ops/ms Iteration 5: 2130.322 ops/ms # Run progress: 87.48% complete, ETA 00:00:46 # Fork: 2 of 2 # Warmup Iteration 1: 2207.800 ops/ms # Warmup Iteration 2: 2269.887 ops/ms # Warmup Iteration 3: 2239.005 ops/ms Iteration 1: 2001.840 ops/ms Iteration 2: 2047.698 ops/ms Iteration 3: 2349.138 ops/ms Iteration 4: 2362.165 ops/ms Iteration 5: 2305.982 ops/ms Result "ltd.newbee.mall.MethodNameTest.m4": 2220.688 ±(99.9%) 186.910 ops/ms [Average] (min, avg, max) = (2001.840, 2220.688, 2362.165), stdev = 123.629 CI (99.9%): [2033.778, 2407.598] (assumes normal distribution)直接看最后 Result "ltd.newbee.mall.MethodNameTest.m4": 这里,平均 ops 是每毫秒 2220 次。对比 第一种和第二种方案的 几十 ops 来说性能提升也很客观,但是对比第三种方法的上万级别 ops 还是不足。
Benchmark           Mode  Cnt      Score     Error   Units
MethodNameTest.m1  thrpt   10     17.267 ±   0.184  ops/ms
MethodNameTest.m2  thrpt   10     25.280 ±   1.088  ops/ms
MethodNameTest.m3  thrpt   10  10702.347 ± 672.631  ops/ms
MethodNameTest.m4  thrpt   10   2220.688 ± 186.910  ops/ms
MethodNameTest.m1     ss   10      0.686 ±   0.289   ms/op
MethodNameTest.m2     ss   10      0.339 ±   0.287   ms/op
MethodNameTest.m3     ss   10      0.031 ±   0.011   ms/op
MethodNameTest.m4     ss   10      0.074 ±   0.027   ms/op
根据最后得分可以看出,四种方案中性能最好的方案是基于匿名内部类的 getClass().getEnclosingMethod() 方案,性能第二是的是基于 Java 9 出现的 Stack-Walking API 方案,其他两种性能过于低下了。